Market Outlook
February 01, 2018
Market Cues
Domestic Indices
Chg (%)
(Pts)
(Close)
Indian markets are likely to open flat tracking global indices and SGX Nifty.
BSE Sensex
(0.2)
(69)
35,965
US stocks fluctuated over the course of the trading session after failing to sustain an
Nifty
(0.2)
(22)
11,028
early move to the upside. The major averages bounced back and forth across the
Mid Cap
(1.3)
(227)
17,364
unchanged line before closing modestly higher.The Dow Jones rose to 0.3% to close
Small Cap
(0.8)
(157)
18,717
at 26,149 and the Nasdaq Composite edged up to 0.1%, to 7,411.
Bankex
0.4
125
30,986
U.K. shares were marginally higher even as Capital Group shares plunged more
than a third after the government contractor issued a profit warning for 2018. The
Global Indices
Chg (%)
(Pts)
(Close)
FTSE 100 was up by 0.1% to close at 7,592.
Dow Jones
0.3
72
26,149
Nasdaq
0.1
9
7,411
On domestic front, Indian shares ended slightly lower as investors awaited cues from
Thursday's budget that will be the last full year budget of the government before next
FTSE
0.1
5
7,592
year's Lok Sabha election. The Sensex ended on a downside front of 0.2% at 35,965
Nikkei
(0.8)
(194)
23,098
while the Nifty ended at 11,028 with a downside of 0.2%.
Hang Seng
0.9
280
32,887
Shanghai Com
(0.2)
(7)
3,481
News Analysis
Result Review: Alembic Pharmaceuticals (CMP: `568 / TP: /)
Advances / Declines
BSE
NSE
Detailed analysis on Pg2
Advances
1,047
418
Investor’s Ready Reckoner
Declines
1,785
1,387
Unchanged
160
49
Key Domestic & Global Indicators
Stock Watch: Latest investment recommendations on 150+ stocks
Refer Pg5 onwards
Volumes (` Cr)
BSE
5,285
Top Picks
NSE
37,713
CMP
Target
Upside
Company
Sector
Rating
(`)
(`)
(%)
Blue Star
Capital Goods
Buy
752
867
15.3
Net Inflows (` Cr)
Net
Mtd
Ytd
Dewan Housing Finance
Financials
Buy
582
712
22.3
FII
644
13,216
13,216
Asian Granito
Other
Buy
552
651
17.9
Navkar Corporation
Other
Buy
179
265
48.2
*MFs
(8)
5,003
5,003
KEI Industries
Capital Goods Accumulate
388
436
12.5
More Top Picks on Pg4
Top Gainers
Price (`)
Chg (%)
Intellect
178
9.4
Key Upcoming Events
Previous
Consensus
Kscl
515
5.6
Date
Region
Event Description
Reading
Expectations
Kansainer
509
5.5
Feb01
UK
PMI Manufacturing
56.30
56.50
Jaicorpltd
182
5.3
Feb01
US
Initial Jobless claims
233.00
235.00
Feb01
Germany PMI Manufacturing
61.20
61.20
Tv18Brdcst
62
5.1
Feb01
US
FOMC rate decision
1.50
1.50
Feb02
US
Change in Nonfarm payrolls
148.00
180.00
Top Losers
Price (`)
Chg (%)
More Events on Pg7
Vakrangee
365
(20.0)
Pcjeweller
485
(6.9)
Rnaval
46
(6.6)
Kajariacer
634
(6.1)
Havells
522
(5.6)
As on January 31 2018
Market Outlook
February 01, 2018
News Analysis
Result Review: Alembic Pharmaceuticals (CMP: `568 / TP: /)
Alembic Pharmaceuticals posted better than expected 3QFY2018 results today, on
OPM front. In rupee terms, consolidated revenues came in at `840cr V/s `777cr in
3QFY2017, up 8.0% yoy. In terms, of the geography, International Generics
(`311cr) a yoy growth of 3.0%, while Indian Formulations (`349cr), posted a 14%
yoy growth. On profitability front, the company posted an EBITDA of 22.0% V/s
19.0% in 3QFY2017, a yoy 300bps expansion. The expansion in the EBITDA
margins is on back of lower R&D expenses. R&D expenses is 12% of sales in
3QFY2018 V/s 16% of sales in 3QFY2017. Consequently, the Adj. PAT came in at
`131cr V/s
`87cr in 3QFY2017, yoy growth of
52.0%, mainly driven by
improvement in EBITDA margins.
We recommend a neutral rating on the stock.
Y/E
Sales OPM
PAT
EPS ROE P/E P/BV EV/EBITDA EV/Sales
March
(` cr)
(%)
(` cr)
(`)
(%)
(x)
(x)
(x)
(x)
FY2018E
3,346
20.6
422
22.4
20.2
25.4
4.7
15.4
3.2
FY2019E
3,915
21.2
510
27.1
20.4
21.0
3.9
12.8
2.7
Economic and Political News
Central Railway to run 452 special trains to clear summer vacation rush
Modi govt sets firm eyes on the sea as new source of major exports
Jayant Sinha bats for low-cost long-haul flights to Europe, West Coast
World Bank to lend $100 million to boost Tamil Nadu's rural economy
Corporate News
Columbia Asia looks at cluster approach for growth, plans hospital in Pune
HC allows Daiichi plea seeking Rs 35.6bn arbitral award against Singh Bros
As coal prices rise, power cos feel the heat with higher cost pressure
Reliance Jio mulls Android Go-based smartphone at throwaway price
Market Outlook
February 01, 2018
Quarterly Bloomberg Brokers Consensus Estimate
Titan Ltd - Feb 01, 2018
Particulars ( ` cr)
3QFY18E
3QFY17
y-o-y (%)
2QFY18
q-o-q (%)
Sales
4,564
3,968
15.1
3,473
31.5
EBIDTA
472
347
36.1
397
18.9
%
10.3
8.8
11.4
PAT
330
232
42.3
277
19.1
Bajaj Finance - Feb 01, 2018
Particulars ( `cr)
3QFY18E
3QFY17
y-o-y (%)
2QFY18
q-o-q (%)
PAT
564
555
1.6
556
1.4
MRF Ltd. - Feb 01, 2018
Particulars ( ` cr)
3QFY18E
3QFY17
y-o-y (%)
2QFY18
q-o-q (%)
Sales
3,664
3,175
15.4
3,591
2.1
EBIDTA
640
566
13.1
605
5.8
%
17.5
17.8
16.8
PAT
345
288
19.8
299
15.4
Ashok Leyland Ltd. - Feb 01, 2018
Particulars ( ` cr)
3QFY18E
3QFY17
y-o-y (%)
2QFY18
q-o-q (%)
Sales
6,697
4,516
48.3
6,046
10.8
EBIDTA
721
390
84.4
609
18.4
%
10.8
8.6
10.1
PAT
401
161
149.1
334
20.1
Power Grid Ltd. - Feb 01, 2018
Particulars ( ` cr)
3QFY18E
3QFY17
y-o-y (%)
2QFY18
q-o-q (%)
Sales
7,579
6,629
14.4
7,252
4.5
EBIDTA
6,773
5,950
13.8
6,474
4.6
%
89.4
89.7
89.2
PAT
2,224
1,930
15.3
2,141
3.8
Cummins India Ltd. - Feb 01, 2018
Particulars ( ` cr)
3QFY18E
3QFY17
y-o-y (%)
2QFY18
q-o-q (%)
Sales
1,428
1,355
5.4
1,153
23.8
EBIDTA
224
226
(0.8)
167
34.1
%
15.7
16.7
14.5
PAT
201
198
1.5
152
32.3
Market Outlook
February 01, 2018
Top Picks
Market Cap
CMP
Target
Upside
Company
Rationale
(` Cr)
(`)
(`)
(%)
Strong growth in domestic business due to its leade`hip
in acute therapeutic segment. Alkem expects to launch
Alkem Laboratories
26,304
2,200
2,441
11.0
more products in USA, which bodes for its international
business.
We expect the company would report strong profitability
Asian Granito
1,661
552
651
17.9
owing to better product mix, higher B2C sales and
amalgamation synergy.
Favorable outlook for the AC industry to augur well for
Cooling products business which is out pacing the
Blue Star
7,214
752
867
15.3
market growth. EMPPAC division's profitability to
improve once operating environment turns around.
With a focus on the low and medium income (LMI)
consumer segment, the company has increased its
Dewan Housing Finance
18,261
582
712
22.3
presence in tier-II & III cities where the growth
opportunity is immense.
Loan growth is likely to pick up after a sluggish FY17.
Lower credit cost will help in strong bottom-line growth.
Karur Vysya Bank
8,057
111
160
44.3
Increasing share of CASA will help in NIM
improvement.
High order book execution in EPC segment, rising B2C
KEI Industries
3,037
388
436
12.5
sales and higher exports to boost the revenues and
profitability
Expected to benefit from the lower capex requirement
Music Broadcast
2,167
380
475
25.0
and 15 year long radio broadcast licensing.
Massive capacity expansion along with rail advantage
Navkar Corporation
2,692
179
265
48.2
at ICD as well CFS augur well for the company
Strong brands and distribution network would boost
Siyaram Silk Mills
3,035
648
851
31.4
growth going ahead. Stock currently trades at an
inexpensive valuation.
Market leadership in Hindi news genre and no.
2
viewership ranking in English news genre, exit from the
TV Today Network
2,686
450
500
11.1
radio business, and anticipated growth in ad spends by
corporate to benefit the stock.
After GST, the company is expected to see higher
volumes along with improving product mix. The Gujarat
Maruti Suzuki
2,87,404
9,514
10,619
11.6
plant will also enable higher operating leverage which
will be margin accretive.
We expect loan book to grow at 24.3% over next two
GIC Housing
2,271
422
655
55.3
year; change in borrowing mix will help in NIM
improvement
We expect CPIL to report net Revenue/PAT CAGR of
~17%/16% over FY2017-20E mainly due to healthy
7,135
321
400
24.6
growth in plywood & lamination business, forayed into
Century Plyboards India
MDF & Particle boards on back of strong brand &
distribution network.
We expect sales/PAT to grow at 13.5%/20% over next
LT Foods
2,895
91
128
41.4
two years on the back of strong distribution network &
addition of new products in portfolio.
We expect sales/PAT to grow at 13%/16% over next two
years on the back of strong healthy demand in writing
Ruchira Papers
406
181
244
34.8
& printing paper and Kraft paper. Further, China had
banned making paper from waste pulp which would
benefit Indian paper companies.
We expect financialisation of savings and increasing
Aditya Birla Capital
38713
170
230
35.3
penetration in Insurance & Mutual fund would ensure
steady growth.
Source: Company, Angel Research
Market Outlook
February 01, 2018
Fundamental Call
Market Cap
CMP
Target
Upside
Company
Rationale
(` Cr)
(`)
(`)
(%)
CCL is likely to maintain the strong growth trajectory
CCL Products
3,922
295
360
22.1
over FY18-20 backed by capacity expansion and new
geographical foray
We forecast Nilkamal to report top-line CAGR of ~9%
to `2,635cr over FY17-20E on the back of healthy
Nilkamal
2,700
1,809
2,178
20.4
demand growth in plastic division. On the bottom-line
front, we estimate ~10% CAGR to `162cr owing to
improvement in volumes.
We expect sales/PAT to grow at 9%/14% over next two
years on the back of healthy demand growth in
Shreyans Industries
256
185
247
33.3
printing. Further, China had banned making paper
from waste pulp which would benefit Indian paper
companies.
The prism has diversified exposure in the different
segment such as Cement, Tile & ready mix concrete.
Prism Cement
6,964
138
160
15.6
Thus we believe, PCL is in the right place to capture
ongoing government spending on affordable housing
and infrastructure projects.
Source: Company, Angel Research
Market Outlook
February 01, 2018
Key Upcoming Events
Result Calendar
Date
Company
February 01, 2018
Ashok Leyland, CEAT, Cummins India, MRF, Power Grid Corpn
February 02, 2018
Tata Global, Bajaj Auto, Hindalco, Electrosteel Castings, GSK Pharma
Source: Bloomberg, Angel Research
Global economic events release calendar
Bloomberg Data
Date
Time
Country
Event Description
Unit
Period
Last Reported
Estimated
Feb 01, 2018
3:00 PMUK
PMI Manufacturing
Value
Jan
56.30
56.50
7:00 PMUS
Initial Jobless claims
Thousands
Jan 27
233.00
235.00
2:25 PMGermany PMI Manufacturing
Value
Jan F
61.20
61.20
12:30 AMUS
FOMC rate decision
%
Jan 31
1.50
1.50
Feb 02, 2018
7:00 PMUS
Change in Nonfarm payrolls
Thousands
Jan
148.00
180.00
7:00 PMUS
Unnemployment rate
%
Jan
4.10
4.10
Feb 05, 2018
2:25 PMGermany PMI Services
Value
Jan F
57.00
Feb 07, 2018
2:30 PMIndia
RBI Reverse Repo rate
%
Feb 7
5.75
2:30 PMIndia
RBI Repo rate
%
Feb 7
6.00
2:30 PMIndia
RBI Cash Reserve ratio
%
Feb 7
4.00
Feb 08, 2018
China
Exports YoY%
% Change
Jan
10.90
5:30 PMUK
BOE Announces rates
% Ratio
Feb 8
0.50
0.50
Feb 09, 2018
7:00 AMChina
Consumer Price Index (YoY)
% Change
Jan
1.80
3:00 PMUK
Industrial Production (YoY)
% Change
Dec
2.50
Feb 12, 2018
5:30 PMIndia
Industrial Production YoY
% Change
Dec
8.40
Source: Bloomberg, Angel Research
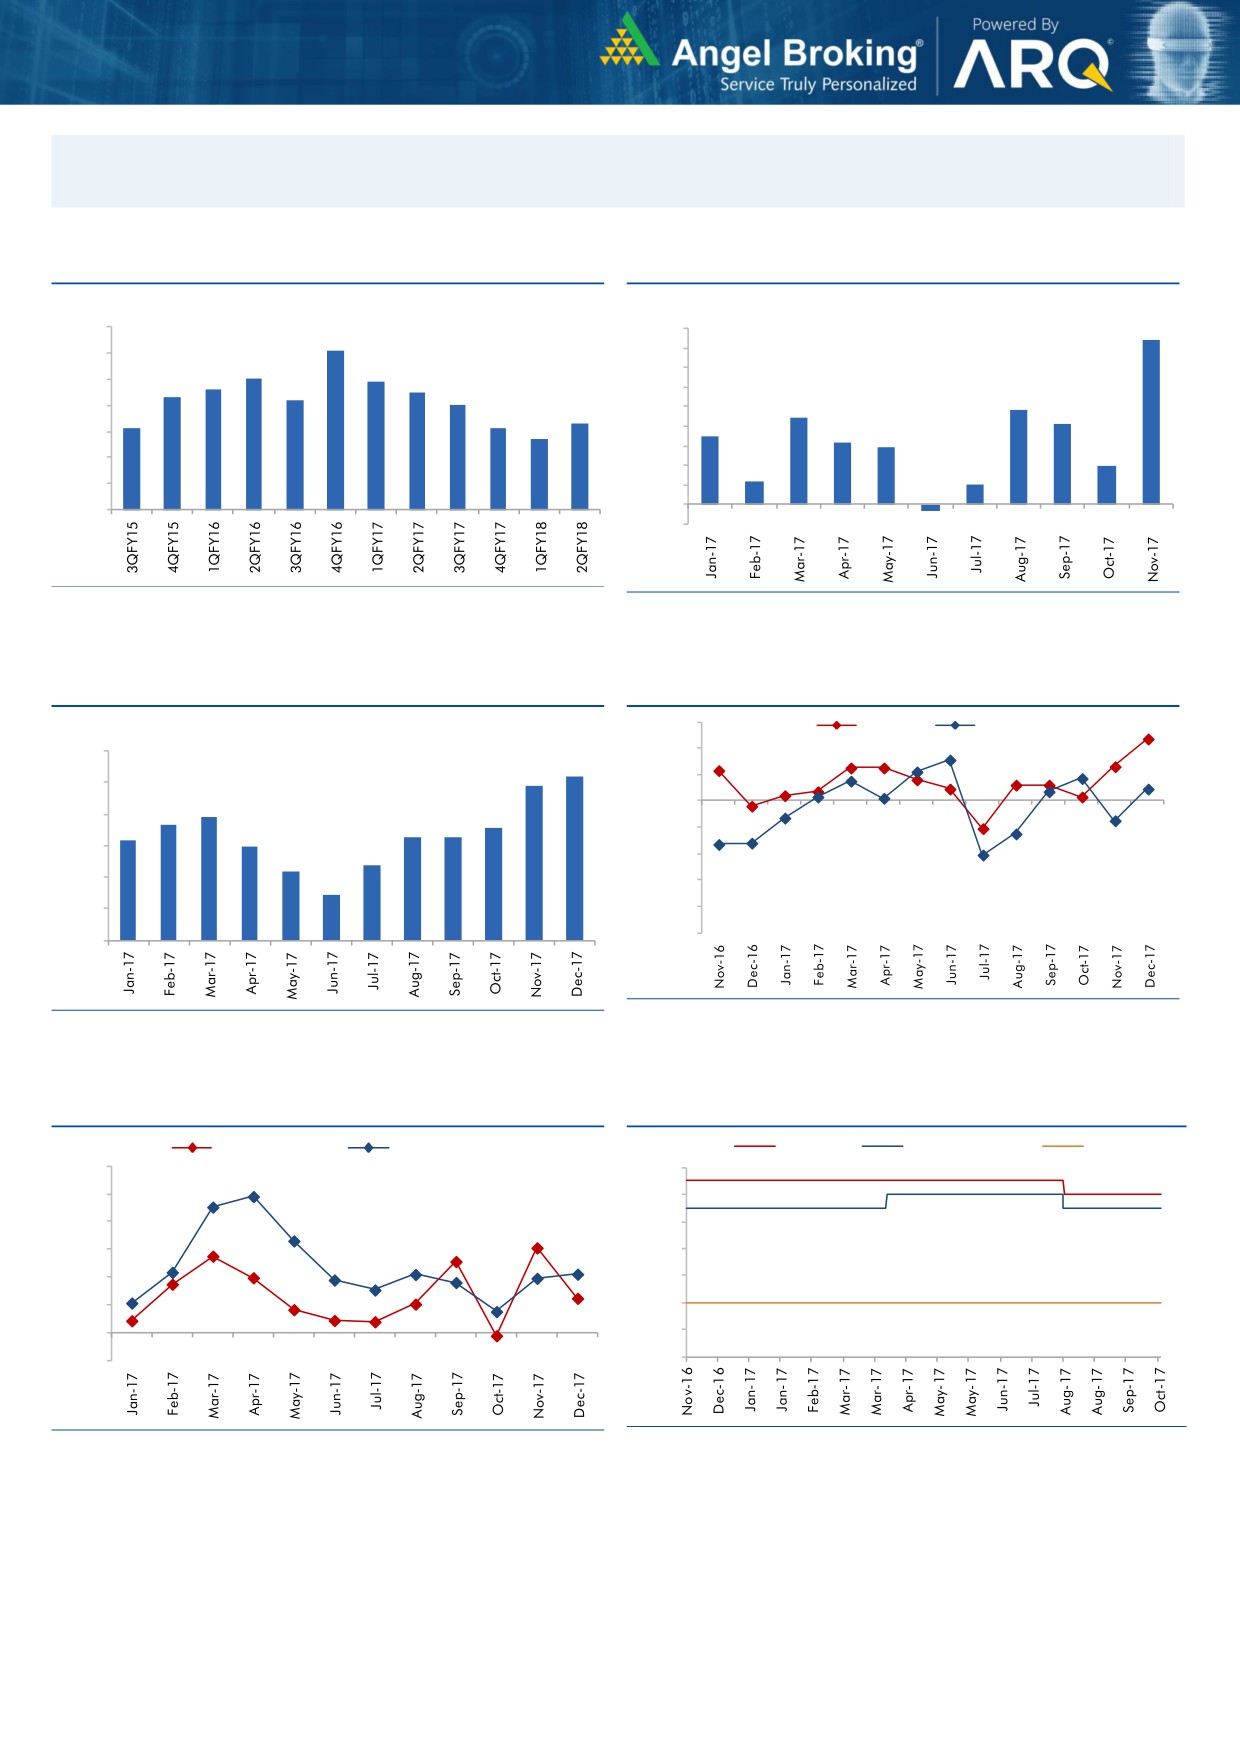
Market Outlook
February 01, 2018
Macro watch
Exhibit 1: Quarterly GDP trends
Exhibit 2: IIP trends
(%)
(%)
10.0
9.0
8.4
9.1
9.0
8.0
8.0
7.9
7.0
7.6
7.5
8.0
7.3
7.2
7.0
6.0
4.8
7.0
6.3
5.0
4.4
4.1
6.1
6.1
5.7
3.5
3.2
6.0
4.0
2.9
3.0
2.0
5.0
2.0
1.2
1.0
4.0
1.0
-
3.0
(1.0)
(0.3)
Source: CSO, Angel Research
Source: MOSPI, Angel Research
Exhibit 3: Monthly CPI inflation trends
Exhibit 4: Manufacturing and services PMI
56.0
Mfg. PMI
Services PMI
(%)
6.0
54.0
5.2
4.9
52.0
5.0
3.9
50.0
3.7
3.6
4.0
3.3
3.3
3.2
3.0
48.0
3.0
2.4
2.2
46.0
2.0
1.5
44.0
1.0
42.0
40.0
-
Source: Market, Angel Research; Note: Level above 50 indicates expansion
Source: MOSPI, Angel Research
Exhibit 5: Exports and imports growth trends
Exhibit 6: Key policy rates
(%)
Exports yoy growth
Imports yoy growth
(%)
Repo rate
Reverse Repo rate
CRR
60.0
6.50
50.0
6.00
40.0
5.50
30.0
5.00
20.0
4.50
10.0
4.00
0.0
3.50
(10.0)
3.00
Source: Bloomberg, Angel Research
Source: RBI, Angel Research
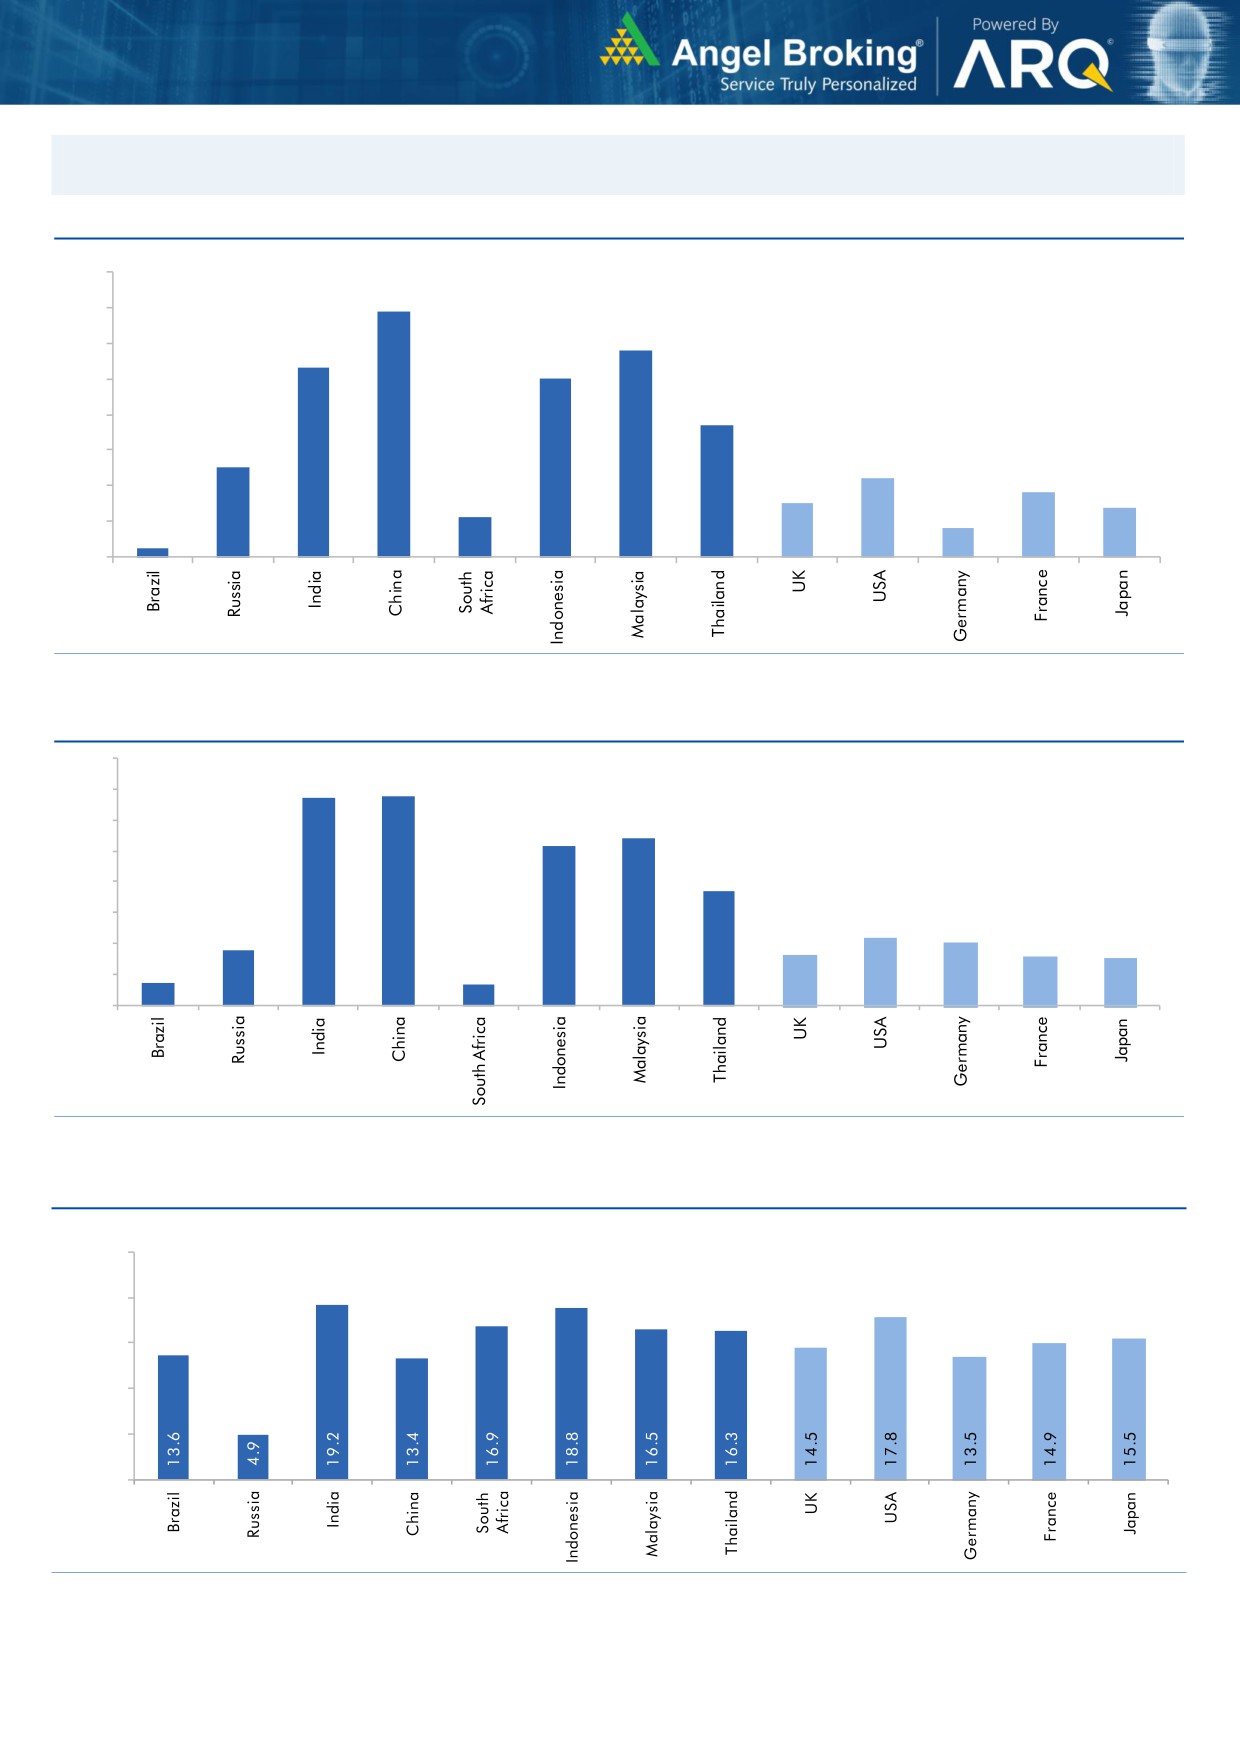
Market Outlook
February 01, 2018
Global watch
Exhibit 1: Latest quarterly GDP Growth (%, yoy) across select developing and developed countries
(%)
8.0
6.9
7.0
5.8
6.0
5.3
5.0
5.0
1.1
3.7
4.0
2.5
3.0
2.2
1.8
2.0
1.5
1.4
0.8
1.0
0.3
-
Source: Bloomberg, Angel Research
Exhibit 2: 2017 GDP Growth projection by IMF (%, yoy) across select developing and developed countries
(%)
6.7
6.8
7.0
6.0
5.4
5.2
5.0
3.7
4.0
3.0
1.8
2.2
2.0
1.7
1.6
2.0
0.7
1.5
0.7
1.0
-
Source: IMF, Angel Research
Exhibit 3: One year forward P-E ratio across select developing and developed countries
(x)
25.0
20.0
15.0
10.0
5.0
-
Source: IMF, Angel Research
Market Outlook
February 01, 2018
Exhibit 4: Relative performance of indices across globe
Returns (%)
Country
Name of index
Closing price
1M
3M
1YR
Brazil
Bovespa
84,482
11.6
12.0
30.9
Russia
Micex
2,280
8.5
10.5
3.1
India
Nifty
11,050
4.7
6.7
27.6
China
Shanghai Composite
3,488
5.3
2.5
11.0
South Africa
Top 40
52,700
0.2
0.3
14.8
Mexico
Mexbol
50,383
3.1
3.1
7.0
Indonesia
LQ45
1,103
2.4
12.2
25.3
Malaysia
KLCI
1,869
5.0
7.0
12.2
Thailand
SET 50
1,186
5.0
8.8
21.5
USA
Dow Jones
26,077
5.3
11.4
31.3
UK
FTSE
7,588
(0.5)
1.1
6.8
Japan
Nikkei
23,292
1.5
6.8
24.0
Germany
DAX
13,198
2.4
0.1
13.4
France
CAC
5,474
3.2
(0.2)
14.7
Source: Bloomberg, Angel Research p68in4
Market Outlook
February 01, 2018
Research Team Tel: 022 - 39357800
DISCLAIMER
Angel Broking Private Limited (hereinafter referred to as “Angel”) is a registered Member of National Stock Exchange of India
Limited,Bombay Stock Exchange Limited and Metropolitan Stock Exchange Limited. It is also registered as a Depository Participant with
CDSL and Portfolio Manager with SEBI. It also has registration with AMFI as a Mutual Fund Distributor. Angel Broking Private Limited is a
registered entity with SEBI for Research Analyst in terms of SEBI (Research Analyst) Regulations, 2014 vide registration number
INH000000164. Angel or its associates has not been debarred/ suspended by SEBI or any other regulatory authority for accessing
/dealing in securities Market. Angel or its associates/analyst has not received any compensation / managed or
co-managed public offering of securities of the company covered by Analyst during the past twelve months.
This document is solely for the personal information of the recipient, and must not be singularly used as the basis of any investment
decision. Nothing in this document should be construed as investment or financial advice. Each recipient of this document should make
such investigations as they deem necessary to arrive at an independent evaluation of an investment in the securities of the companies
referred to in this document (including the merits and risks involved), and should consult their own advisors to determine the merits and
risks of such an investment.
Reports based on technical and derivative analysis center on studying charts of a stock's price movement, outstanding positions and
trading volume, as opposed to focusing on a company's fundamentals and, as such, may not match with a report on a company's
fundamentals. Investors are advised to refer the Fundamental and Technical Research Reports available on our website to evaluate the
contrary view, if any.
The information in this document has been printed on the basis of publicly available information, internal data and other reliable
sources believed to be true, but we do not represent that it is accurate or complete and it should not be relied on as such, as this
document is for general guidance only. Angel Broking Pvt. Limited or any of its affiliates/ group companies shall not be in any way
responsible for any loss or damage that may arise to any person from any inadvertent error in the information contained in this report.
Angel Broking Pvt. Limited has not independently verified all the information contained within this document. Accordingly, we cannot
testify, nor make any representation or warranty, express or implied, to the accuracy, contents or data contained within this document.
While Angel Broking Pvt. Limited endeavors to update on a reasonable basis the information discussed in this material, there may be
regulatory, compliance, or other reasons that prevent us from doing so.
This document is being supplied to you solely for your information, and its contents, information or data may not be reproduced,
redistributed or passed on, directly or indirectly.
Neither Angel Broking Pvt. Limited, nor its directors, employees or affiliates shall be liable for any loss or damage that may arise from
or in connection with the use of this information.